

Imagine a team excited by new data. They start working, but months later have nothing useful to show. This is common. In fact, one analyst from Gartner reported that around 85% of big data and AI projects end in failure. If airlines only landed 15 out of 100 planes, no one would fly. The same logic applies here: without a clear process, data science efforts often miss the mark. The solution is to use a well-defined data science life cycle – a roadmap of steps that turns raw data into real results.
The data science life cycle is more than a to-do list. It’s a clear plan from start to finish. Without it, teams may move fast but go in the wrong direction. A standard life cycle keeps everyone on track. It starts with understanding the business problem, then moves through data gathering, cleaning, exploring, modeling, testing, and finally deploying and monitoring the model in use. Each step leads to the next. Skip one step, and the project can fall apart. Stay too long on one step, and the business problem might change. The real skill is balancing speed with care – which a standard process helps achieve.
1. Business Understanding: Start with a Clear Goal
Before writing any code or opening a data file, the team must ask: “What problem are we solving?” The most common mistake is to dive into data without a clear goal. Projects drift off course when data teams work without a agreed success measure. Companies that follow a set process always begin with a clear problem statement. They write down the goal, decide how success will be measured, and get sign-off from stakeholders before moving on.
Example: A large retailer once tried to use data to reduce excess stock. But they jumped into building a broad demand forecast model without confirming the actual need. After six months they discovered the business wanted a specific alert system for overstocked items – not a general forecast. Those six months were wasted. A proper kickoff (with a written goal and review) would have spotted the gap in the first week.
Key points of this stage:
-
Define the goal: What exact problem are we solving?
-
Measure success: How will we know if the project worked?
-
Stakeholder approval: Make sure decision-makers agree before starting.
Without this step, projects quickly lose focus.
2. Data Collection: Gathering the Right Data
Once the goal is clear, the team collects the data needed. Data can come from many sources: company databases, online APIs, surveys, sensors, and outside vendors. Good data collection means knowing exactly where data comes from, who owns it, and how to access it before the project starts.
In practice, teams often spend a lot of time here. On average, data scientists spend 60–80% of their time collecting and preparing data. That may seem surprising – you might expect data science to be mostly fancy algorithms – but most of the work is just getting the data ready. Teams with a standard process know all the sources up front. They set up data pipelines or scripts to pull data from each source. That way the data arrives the same way every time, avoiding mid-project surprises.
Important actions in this stage:
-
List needed data sources (databases, files, APIs, etc.).
-
Get access and permissions for each source.
-
Plan how to extract and combine the data into one place.
A clear plan for data collection saves time and headaches later.
3. Data Preparation (Cleaning): Fixing Messy Data
Raw data is almost always messy. For example, it may have missing values, duplicate entries, mixed-up formats, or incorrect entries. Data cleaning is the process of fixing these issues so the data can be used. Common problems include:
-
Missing values: Fields that are blank or null (sometimes 30–40% of records can have gaps).
-
Duplicates: The same record appears more than once.
-
Inconsistent formats: Dates or text written in different ways (e.g., “01/02/2024” vs “February 1st, 2024”).
Outliers: Values that make no sense (like negative ages).
Cleaning the data usually takes the most time in a project. For example, one study noted that data scientists spend about 80% of their time on data wrangling tasks. A standardized process can automate much of this work and reduce mistakes.
Consider this simple example of messy vs. cleaned data:
DATA CLEANING PIPELINE 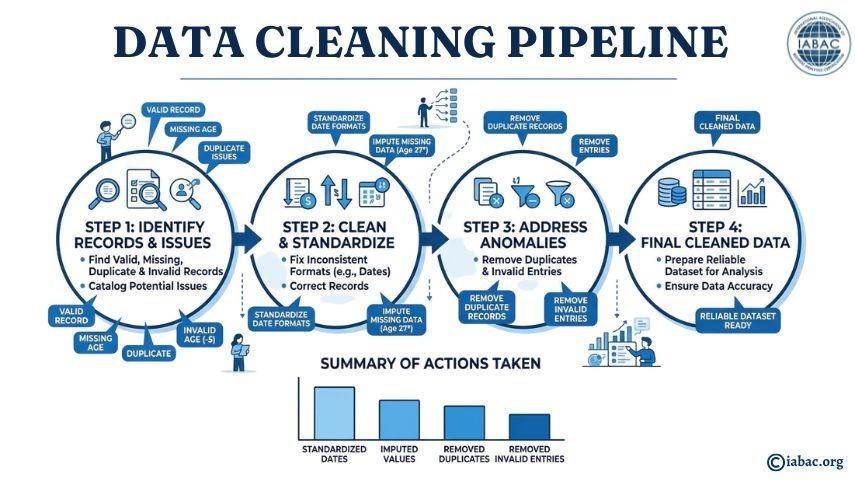
In the cleaned table:
-
Dates are all in the same format (YYYY-MM-DD).
-
Missing age for CustomerID 102 is estimated (an asterisk means it was filled in).
-
The duplicate and the negative age record are removed.
By coding these steps into a repeatable pipeline, teams avoid manual errors and save weeks of work on future projects.
4. Exploratory Data Analysis (EDA): Understanding the Data
Once the data is clean, the team explores it to understand patterns and quirks before building any models. This stage is called Exploratory Data Analysis (EDA). During EDA, data scientists look at summaries and plots to answer questions like:
-
How are the data values distributed? (e.g. Are most ages young, old, or evenly spread?)
-
Are there any obvious patterns or relationships? (e.g. Do customers who buy more also spend more?)
Are there unusual outliers? (e.g. One customer who spent 100 times more than anyone else.)
EDA often uses charts such as histograms (to see distributions), box plots (to spot outliers), scatter plots (to check relationships), and correlation matrices (to measure how factors move together). The goal is to get an intuitive feel for the data, identify any remaining issues, and discover clues about what features might predict the outcome.
For example, in healthcare data projects, EDA might reveal that social factors like distance from the hospital or type of insurance are more linked to patient readmissions than medical readings like blood pressure. That kind of insight could completely change the modeling approach. Without EDA, you might never notice those insights. In short, EDA helps you “get to know” your data.
Key aspects of EDA:
-
Data summaries: Compute averages, counts, and percentiles.
-
Visualizations: Use charts (histograms, bar charts, scatter plots) to see patterns.
-
Feature relationships: Check correlations (for example, using a correlation heatmap).
-
Check assumptions: Look for unexpected issues (e.g., a feature that should be numeric is actually mostly empty strings).
Thanks to EDA, a team might discover that the target value (what they want to predict) is skewed or that two features are almost identical. Fixing those issues now can make modeling more successful later.
5. Modeling: Building Predictive Models
Now it’s time to build machine learning models on the prepared data. This is often the most exciting part, but remember, models are just one step in the journey. Companies that follow a standard process make sure that every model choice is documented and tested, instead of just going with a favorite algorithm.
There are many common algorithms to choose from. For example:
| Algorithm Type | Example Use Case |
| Linear Regression | Predicting house prices |
| Logistic Regression | Predicting customer churn (Yes/No) |
| Decision Trees | Classifying loan applicants |
| Random Forests | Detecting fraud |
| Neural Networks | Image recognition and language processing |
| K-Means Clustering | Grouping customers based on purchase behavior |
| XGBoost / LightGBM | High-accuracy predictions on tabular data |
Each method has strengths. For instance, linear regression is simple and interpretable, while neural nets can handle complex tasks like images or text. A good data science process requires trying multiple models and comparing them to a baseline. No one algorithm is best for every problem.
Bias-Variance Tradeoff: An important concept during modeling is the bias-variance tradeoff. A very simple model (high bias) might miss real patterns (“underfit”), while a very complex model (high variance) might fit the training data too well and fail on new data (“overfit”). In practice, you want a balance: a model complex enough to capture the true signal, but not so complex that it mistakes noise for pattern.
-
High bias (underfitting): Model is too simple. It leaves out important trends.
-
High variance (overfitting): Model is too complex. It learns the quirks of the training data that won’t hold in the future.
Mathematically, the total prediction error can be seen as Bias² + Variance + irreducible noise. A key step in a standardized process is to document model choices, validate them on separate data, and pick the one with the best real performance, not just personal preference.
6. Evaluation: Measuring Model Quality
After training models, we must check if they actually work well. This means choosing the right evaluation metrics. The most common metrics include:
-
Accuracy: The percentage of correct predictions. Good if classes are balanced.
-
Precision / Recall: Useful for imbalanced problems. Precision is the fraction of predicted positives that are correct, and recall is the fraction of actual positives that were found. For example, in fraud detection, we want high precision (most flagged cases are real fraud) and high recall (catch most fraud).
-
F1-Score: A balance of precision and recall. Often used when data is imbalanced and you care about both false positives and false negatives.
-
AUC-ROC: Measures how well the model separates classes overall. Good for ranking tasks or when you want probabilities.
-
RMSE / MAE: Root Mean Squared Error or Mean Absolute Error, used for regression (predicting numbers).
-
MAPE (Mean Absolute Percentage Error): Another regression metric, shows error as a percentage of actual values.
A classic caution: don’t trust accuracy alone on imbalanced data. Suppose 98% of emails in a dataset are not spam. A model that labels everything as “not spam” achieves 98% accuracy – but it catches no spam at all. In this case, accuracy is meaningless. Precision and recall would reveal the problem. In fact, some real cases have seen 95–97% accuracy models that did nothing useful (e.g. a model that predicted no spam and got 97% accuracy). That’s why selecting the right metric is crucial.
Standard practice is to decide on success metrics before training the models. For example, if you need to catch spam, you might prioritize recall (catching all spam). If you need high confidence in each spam flag, you might prioritize precision. A disciplined team agrees on these goals up front and sticks to them when evaluating models.
7. Deployment: Putting the Model to Work
A model locked away on someone’s laptop or printed on a report isn’t valuable – it needs to be put into use. Deployment is the step where the model is moved into production systems so real users or customers can use it. There are many ways to do this:
-
APIs: Wrap the model in a service (for example, a REST API using Flask or FastAPI) so other applications can call it.
-
Embedded in apps: Include the model in a mobile app or software.
-
Cloud services: Host the model on cloud platforms (AWS SageMaker, Azure ML, etc.) for scalability.
-
Real-time pipelines: Connect the model to live data streams, so predictions happen instantly (common in fraud detection or recommendations).
-
Batch jobs: Run the model regularly on new data (e.g. nightly scoring of customer data).
Deployment is often overlooked, yet it’s critical. Surveys have found that most machine learning models never reach production. For example, a 2022 report noted 87% of ML projects fail to reach production. (That means only about 13% succeed.) It’s usually not because the code is bad, but because teams focus too much on the model and forget about integration, scaling, and maintenance.
Standardizing the life cycle means planning for deployment from the start. It means involving engineers early and setting up the infrastructure needed to host the model. Teams might use tools like Docker, Kubernetes, or MLOps platforms so deployment is smooth. When the process includes a deployment step, far more models end up being used by the company.
8. Monitoring: Ensuring the Model Stays Good
Deployment isn’t the end – it’s a new beginning. Once a model is live, the world continues to change, and the model can drift. Its performance may degrade over time if we don’t watch it. This is why monitoring is the final stage of the life cycle.
Model drift happens when the model’s predictions get worse. This can be due to:
-
Data Drift: The input data changes. For instance, if a model was trained on customer data from last year, and this year customer demographics shift, the inputs now have a different distribution. The model sees “new” kinds of data it wasn’t trained on.
-
Concept Drift: The relationship between inputs and outputs changes. For example, maybe in the past people of a certain age were likely to churn, but now it’s unrelated. The underlying pattern has changed, so the model’s rules no longer apply.
-
Label (Target) Drift: The definition of the “correct answer” itself changes. For example, maybe a credit default definition changes slightly, or what counts as “spam” evolves. This often overlaps with concept drift.
As Aerospike explains, model drift is common because the world around the model keeps changing. A model that worked on old data may start to fail on new data (for example, a fraud model trained before a pandemic might miss new fraud patterns that emerged during the pandemic).
To handle this, a team must continuously monitor the model’s performance. This means tracking key metrics (accuracy, error rate, etc.) in real time or on a schedule. If performance drops below a threshold, it should automatically trigger an alert or a retraining job. Monitoring dashboards can watch for changes in the inputs and outputs. This way, issues are caught early and fixed by retraining the model on fresh data.
Building monitoring into the process – not as an afterthought but as a planned step – ensures the model stays accurate and valuable over time.
Benefits of a Standard Process
Why are companies standardizing their data science life cycle? It’s all about avoiding pain and improving results. Teams that follow a clear process report benefits such as:
-
Faster projects: With a set plan, teams can cut project time by 30–50% (many tasks are already defined).
-
Less rework: Clear goals and data standards mean fewer surprises and changes mid-project.
-
Better teamwork: Everyone (data scientists, engineers, managers) uses the same terms and steps, so there’s less confusion.
-
Traceability: When work is documented step by step, it’s easier to audit for compliance and repeat successes.
-
Higher model quality: Decisions are data-driven, not based on guesswork or personal preference.
-
More models in production: Careful deployment planning means more projects actually deliver value.
For example, a McKinsey study found that companies using customer analytics intensively (following best practices) were far more likely to succeed. They were 23 times more likely to add new customers and 19 times more likely to achieve high profitability than companies that didn’t use analytics well. These massive differences come from using a disciplined, repeatable process for data work.
Avoiding Bias: Don’t “Fall in Love” with a Model
An interesting side benefit of a standardized process is it prevents personal bias. Data scientists often get attached to a model they built – it’s like their “baby.” But if a simpler model works just as well or better, sticking with the fancy one wastes effort. For instance, you might spend weeks tuning a deep neural net, only to find a basic logistic regression performs equally. If you’re too proud, you might ignore the simpler solution.
With a documented process, such decisions are made by the data, not by feelings. Metrics and comparison rules were set in advance, so if the baseline model wins, you use that. This avoids the trap of choosing a model just because someone spent more time on it. In other words, standardization keeps the focus on results, not on who worked harder or on “my model.”
The Role of Certifications
As more companies adopt these standards, they look for people who already know the process. That’s where data science certifications come in. A good certification covers the full life cycle and shows employers you understand industry best practices. For example, the International Association of Business Analytics Certifications (IABAC) offers globally recognized credentials that map to the data science life cycle. Holding such a certification signals you have a shared framework in mind, which can speed up hiring and onboarding. It gives managers confidence that you’ll follow a disciplined approach from problem definition through deployment and monitoring.
If you want to prove your skills in a job market that values standardized processes, a certification could help. (See IABAC’s certification page for details on their programs aligned to real-world needs.)
Example: Bank Reduces Customer Loss
Here’s a step-by-step example of the life cycle in action:
Context: A mid-sized bank in Southeast Asia was losing 18% of its customers each year. They wanted to reduce this with data science.
-
Business Understanding: The goal was written clearly: “Reduce customer churn rate by 5% within 12 months using a predictive model”. Everyone agreed on this target.
-
Data Collection: The team gathered 3 years of data: transactions, customer profiles, service logs, and product usage (4.2 million records total).
-
Data Preparation: They cleaned the data (removing 12% bad records) and engineered 18 new features (e.g. “months since last transaction”, “number of products a customer uses”).
-
EDA: The analysis showed a key insight: customers with only one product and no mobile app use in the last 90 days were 4.7 times more likely to leave. This pattern guided the modeling.
-
Modeling: Three models were tried – Logistic Regression, Random Forest, and XGBoost. XGBoost gave the best result with an AUC-ROC of 0.87.
-
Evaluation: The chosen model had precision 78%, recall 71%, F1-score 74% on the test data. These metrics met the team’s defined targets.
-
Deployment: The model was integrated into the bank’s CRM. Whenever a customer’s churn risk went above 0.65, the system automatically triggered a retention action (like a call or offer).
-
Monitoring: The team set up dashboards to track performance monthly. They retrained the model every three months or if performance dipped.
Result: After one year, customer churn dropped from 18% to 12.3% – a 31.7% improvement. This beat the original goal of 5%. The bank estimated the retained customers were worth about $4.2 million. This success was possible because the project followed each step of the life cycle properly.
Who Is Adopting Standardization?
This move towards standard processes is happening worldwide, across many industries. For example:
-
Finance & Banking: Using it for risk assessment, fraud detection, and credit scoring. Major banks need structured data projects for regulation and accuracy.
-
Healthcare: To reduce readmissions, personalize treatment, and speed up drug research. Hospitals and insurers rely on clear processes for life-critical predictions.
-
Retail & E-commerce: For demand forecasting, customer segmentation, and pricing. Retailers collect a lot of data and use life cycle steps to turn it into better stock management and marketing.
-
Manufacturing: For predictive maintenance and quality control. Industry 4.0 relies on clean data pipelines and monitoring to keep machines running.
-
Telecom: For network optimization and customer retention. Telecom companies use analytics at scale, so they need repeatable processes.
In terms of geography:
-
North America and Europe have been using standardized analytics processes for longer and often lead in data science maturity.
-
Asia-Pacific is now the fastest-growing region for data science adoption
-
. Many companies in China, India, and other countries are rapidly building analytics teams and following global best practices.
-
Latin America and Africa are also catching up. With more cloud access and digital initiatives, countries in these regions are starting new data projects. A recent report notes steady growth in AI and ML in banking, healthcare, and retail across Latin America, Middle East, and Africa.
Conclusion
Standardizing the data science process might sound like it restricts creativity, but it does the opposite: it gives teams clarity and freedom to focus on the hard parts, not on guessing the next step. A clear roadmap removes endless back-and-forth. Stakeholders always know what’s happening. Most importantly, it stops expensive projects from falling apart at the end.
Following a disciplined, step-by-step approach is what the most successful data science professionals do – not because it’s required, but because it works. Great results come not from random effort, but from working systematically. Whether you’re new to data science or leading a team, learning the full life cycle and using it every time is one of the smartest investments you can make.